Week 2: Human Visual System
"The eye is like a mirror and the visible object is like the thing reflected in the mirror."
Avicenna, 11th century.
The Human Visual System has attracted the attention of many scientists, mathematicians and philosophers. One of the earliest vision theories is proposed by Plato, Euclid and Ptolemy. It is called emission theory . According to this theory the light is emanated from the eye, seizing the objects with its rays.
Aristotle noticed that we cannot see in the dark. If the light were emanated from the eye, we would be able to see in the dark. Then, he claimed that the eye received rays, rather than directed them outward. He suggested that the objects are made of two major components: matter and form. It is the form of the objects that enter the eye to make us perceive the physical world. This theory is called intromission theory. In the second century AC, Galen followed the intromission theory and described various properties of the human eye based on this theory.
Hasan Al Ibn Haytham (965-1014 AC), called Alhazen by the western world, was the first scientist to explain that vision occurs, when light bounces on an object and then is directed to one’s eyes. He was, also, the first to demonstrate that vision occurs in the brain, rather than in the eyes.
Video 1: Alhazen was a great scientist of Medieval Islam. He is the first to bring scientific methodologies to study and understand the laws of nature.
Since then many scientists extend the vision theory of Haytham and suggested new theories (Comprehensive vision theories)
Although there are substantial improvements in our knowledge, we still don’t know some of the mysteries about the Human Visual System.
This week, we review the Human Visual System (HVS) from an image processing point of view. Eye -brain channel will set a very good exampler for developing image processing algorithms. We will frequently refer to this marvelous system of nature, to generate artificial vision. We, also, study the characteristics of image perception. We shall briefly overview the contemporary vision theories. We conclude this week by reviewing basic image acquisition technologies.
Electromagnetic Spectrum and Visible Band
In his book of Optics, Alhazen studied the nature of light. He managed to break the white light into its color components by an optical prism. Later, Isaac Newton formalized the wavelengths of electromagnetic waveforms, in color spectrum.
Due to the great contribution of Isaac Newton to the science of optics, Alexander Pope metaphorically rephrased the first sentence of the bible,
”Let there be light !”
to
“ Let Newton be! and all was light”.
Video 2: This video shows the experiment about the decomposition of white light by Isaac Newton.
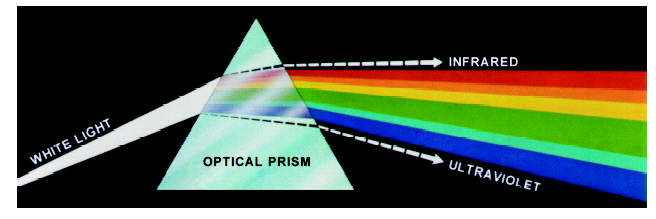
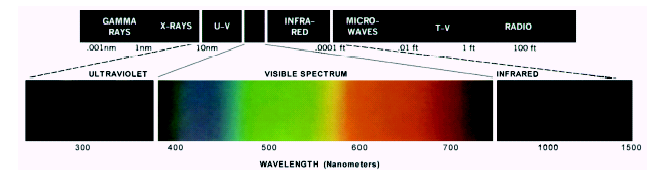
As science progresses, we develop a better understanding about the nature of light. Now, we know that light is an electromagnetic waveform in a narrow bandwidth of 400-800 nanometer. The electromagnetic spectrum has a wide range of other frequencies, outside the visible light, which covers electromagnetic waves with frequencies ranging from below one hertz to above 1025 hertz, corresponding to wavelengths from thousands of kilometers to a fraction of the size of an atomic nucleus. For practical reasons, the electromagnetic spectrum is partitioned into separate bands,
called radio waves, microwaves, infrared, visible light, ultraviolet, X-rays, and gamma rays.
We, humans, can perceive only 7% of the electromagnetic spectrum. between the wavelengths of approximately 400-800 nanometers . This narrow band is coded in our brain by a set of color codes, such as, red, yellow, blue, brown, orange, green, violet, black, pink, orange, blue green, indigo, black, white etc.
Video 3: An optional video, which explains the history of Light.
Human Visual System : Eye-Brain Channel
Like many animals, human beings perceive the physical world by the reflection of electromagnetic waveforms generated by a source in a narrow band, called light.
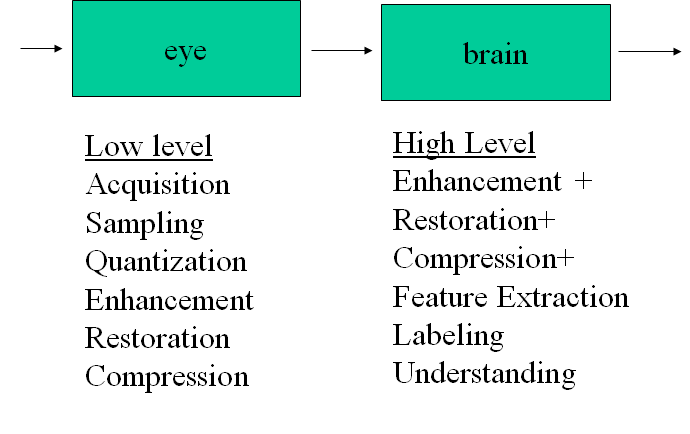
The Human Visual System has two major Image Processing components: Eye and brain.
Let us briefly study how eye-brain channel process visible light to generate and process images of the physical world.
Human Eyes
Our eyes perform low level image processing operations that we shall try to develop algorithms to mitigate them.
Our eyes generate stereoscopic (3–dimensional) digital image by sampling and quantization of a perceived scene or object. This image is enhanced by simple smoothing techniques, performed in the eye. Depending on the characteristics and operating conditions, our eyes make some compression and restoration operations, as well.
Our eyes are 20 mm spherical balls, which can be considered as a feedback control system. It controls
-
the amount of light by adjusting the size of the pupil.
-
the distance from the object by adjusting the focus of the lenz.
-
the eyelid to protect and control the actions of eye
-
eye muscles to control the rotation of the eyeball to adjust the direction of the scene of interest.
Video 4: This video illustrates how our eyes work to generate a digital image out of visible light.
Sampling and Quantization on Retina
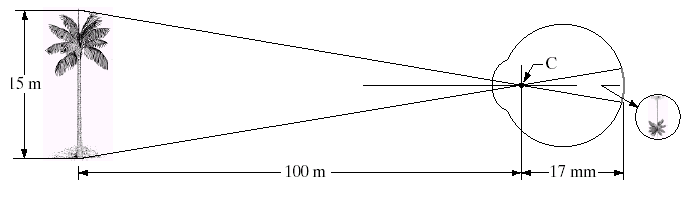
When the light enters into the eyes from pupils, it is attenuated and focused onto fovea by the lenz. Lenz, together with the pupil normalizes the light to the dynamic range of the sensors scattered on the retina. A digital image is generated from this normalized light by light sensitive photoreceptor cells, called rods and cones. There are approximately 100-120 Million rods and 6-7 million cones scattered on the retina. The number of these sensors change depending on the age, sex or genetic properties of a person.
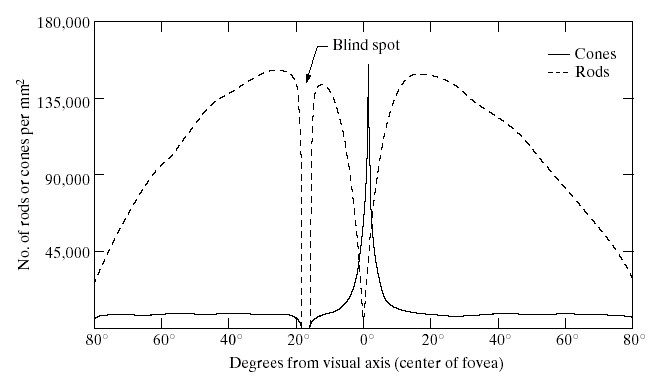
Rods are sensitive to capture the shape of objects.
-
They can capture the shapes even under the dim light.
-
To extract shape, several of them are connected to the same nerve cell.
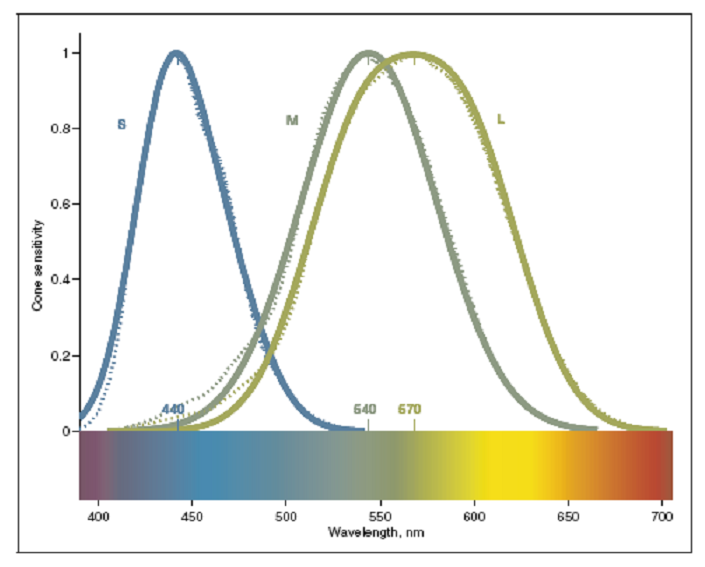
Cones are sensitive to color.
-
They are mostly located on fovea.
-
Each cone is connected to a single nerve cell.
Each of these tiny sensors receives the light, which enters the eye from the pupil in a controlled luminance and generates an electrochemical signal, depending on its type. The bundle of electrochemical signals can be considered as a sampled and quantized digital image of a physical scene.
Human Brain
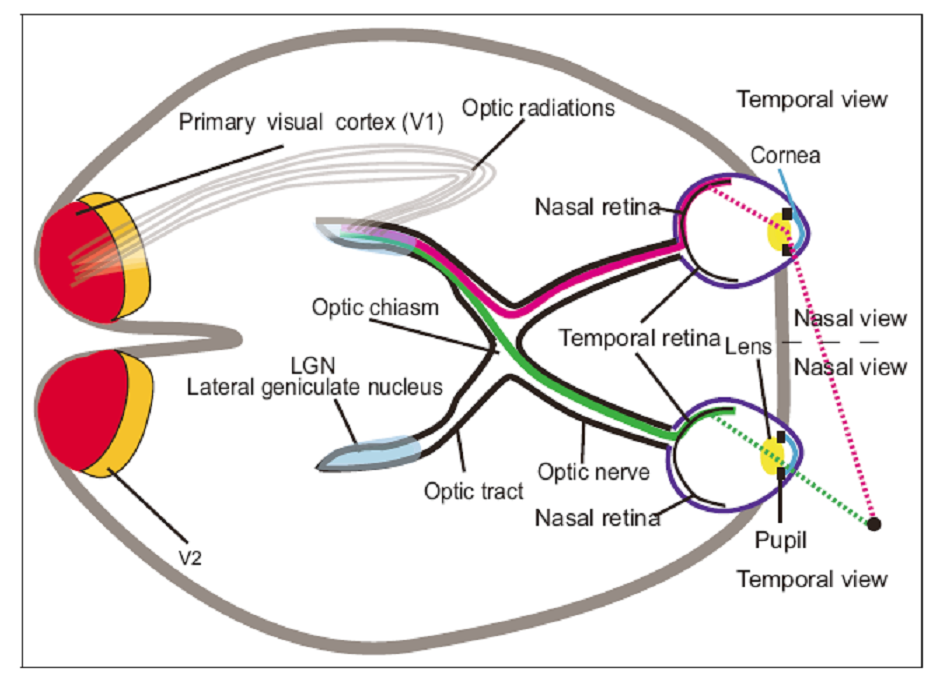
Human brain receives the compressed and enhanced digital image generated by our eyes as the bundles of neural fires. These electrochemical fires are processed in various anatomic regions of the brain hierarchically to further enhance, restore, extract important features and finally generate high level information, such as describing, understanding and interpreting a scene or labeling an object. After all these cognitive processes, we create a physical world model around us and we continuously update this model, as we receive visual information conveyed from our eyes.
Although our knowledge about how we develop the three dimensional physical model is still not well-understood, experimental neuroscience shows that a large number of anatomic regions work together, in a great harmony and coordination, to generate and act upon this vision model. For example,
-
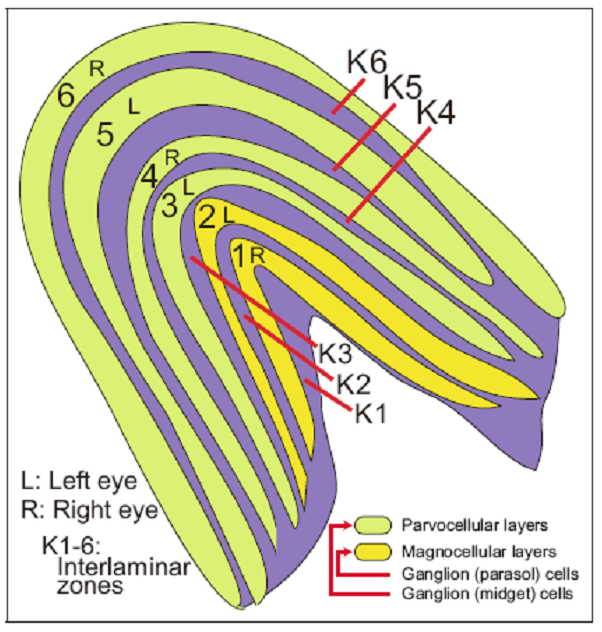
LGN extracts low level features, such as edges, boundaries, textures, colors, corners or lines.
-
Primary visual cortex, called V1, extracts a map of spatial information about the relative location of objects. It, also, highlights what is important from visual inputs to guide the shifts of attention known as gaze shifts.
There are other anatomic regions which are responsible for generation of higher level visual information. These regions, namely, V3, V4, V5, V6 are observed to generate hierarchical libraries of indexed features and tasks related to visual perception, such as recognition interpretation, classification etc. It is estimated that more than 50% percent of the brain is dedicated to vision related cognitive tasks. Yet, there is a lot to be explored.
Vision Theories
Human brain is the most complex system in the known universe. In spite of our great effort, there is still a lot that we do not know how we see. In this section, we briefly study two contemporary vision theories, which are helpful to design image processing systems. These are
-
Marr Theory, suggested by D. Marr
-
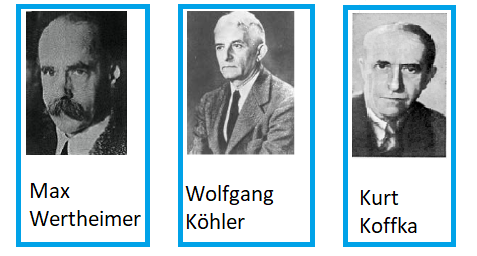
Gestalt Theory, suggested by K. Koffka, M.Wertheimer, W. Köhler
Marr Theory (1970):
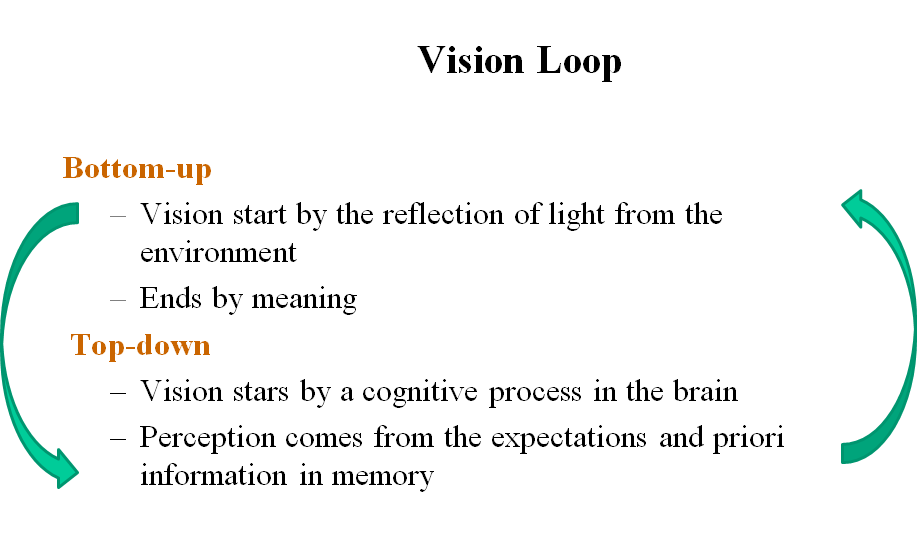
As a neuroscientist, David Marr noticed the bottom up structure of our brain, where the bundle of electrochemical signals are hierarchically merged to create higher and higher level visual information. According to Marr, the Human Visual System is a hierarchical, modular and decomposable computing system. The very complicated hierarchical structure of the brain can be represented in four major levels of abstraction:
-
First, we generate a discrete image by the photoreceptors, rods and cones in the retina,
-
Second, we extract edges, blobs, curves, boundaries etc. to generate a primal sketch in Lateral Geniculate Nucleus.
-
Third, we generate a 2.5 dimensional image by adding surface, orientation and discontinuities in surface and orientation, in V1.
-
Fourth, we generate a 3-dimensional representation of a scene, hierarchically organized, in terms of surface and volumetric primitives, in V2, V3, V4, V5 and V6.
Later Poggio added a fifth level of abstraction to include learning abilities to the HVS.
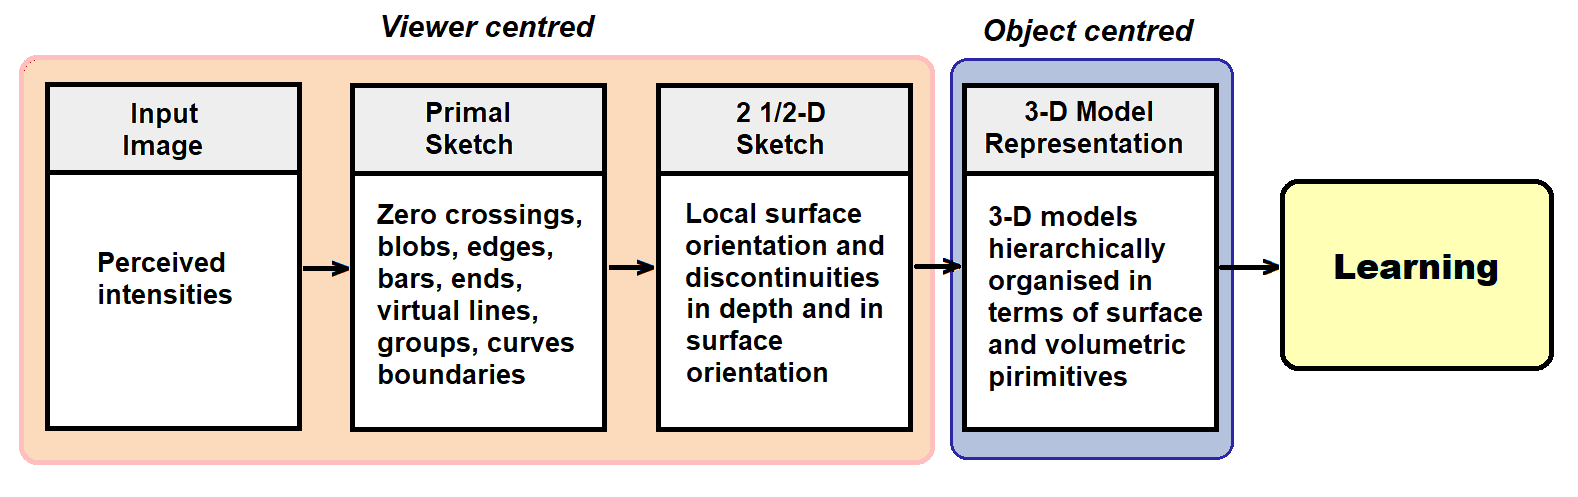
Poggio added a fifth level of abstraction to include learning abilities to the HVS.
Although this very rough model is far from explaining the very complex visual operations of the brain, it is quite practical for designing well-structured and simple image processing algorithms.
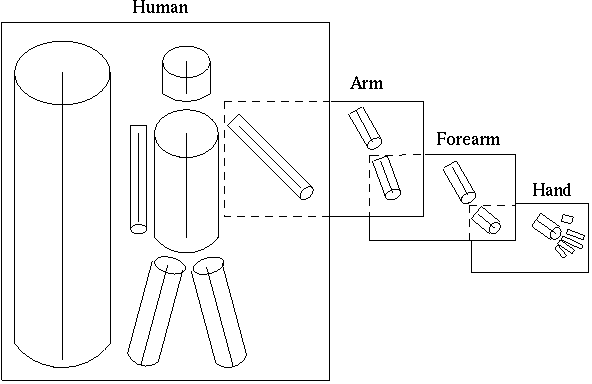
Note that, at the fourth level of abstraction, a hierarchically organized 3-dimensional model of scene is generated. This model enables us to decompose an object to obtain a coarse to fine representation of objects. The recognition process uses a catalogue of 3-D models, which is a collection of stored 3-D model descriptions. This catalog enables the association of a new description with the appropriate ones in the collection. All 3-D model descriptions can be organized in a hierarchy according to the specificity of information they carry.
For example a 3-D model description of a person is depicted in Figure 12. The top level of the hierarchy is a model which does not have a component decomposition and describes the model’s principal axis. At the next level in the hierarchy more details are added to the model, like the number and distribution of subcomponent axes along the principal axis. At the lower levels each individual object’s model receives more precise descriptions, and they can now be distinguished by the angles and length of their components
http://homepages.inf.ed.ac.uk/rbf/CVonline/LOCAL_COPIES/GOMES1/marr.html
This hierarchical representation enables us to design bottom up algorithms independent of each other.
Although Marr theory is very useful to design simple bottom up algorithms of image processing, in a hierarchical and modular way, it has some problems. Human brain processes the information in a highly complex and interdependent manner with a lot of loops and feedback among the anatomic regions. In other words,
-
Vision is not only a bottom up process, but a combination of highly complex bottom up and top down processes.
-
The hierarchical 3- dimensional modules of objects are not independent of each other, but they are strongly related to each other.
-
Vision is not independent of other cognitive processes, such as, other sensory processes, memory, reasoning, planning etc.
Gestalt (Shape) Theory
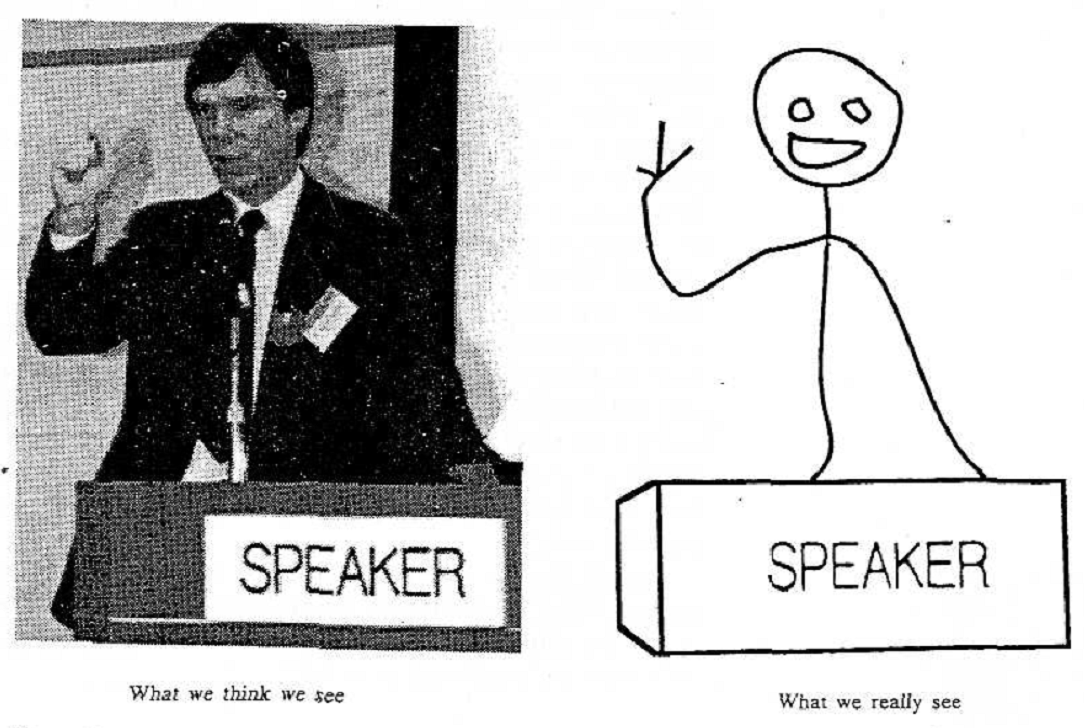
On the contrary of Marr’s theory, Gestalt theory proposes that vision is the product of the interactions between the output stimuli and human brain.
Even if we represent all of the parts perfectly, putting them together, without considering the relationship among them does not make the whole. Because, the hole is bigger than the total of parts.
According to Gestalt Theory, our brain unifies and simplifies the small parts. Therefore, we perceive these simplified objects.
Gestalt Rules
There are a set of rules in Gestalt Theory about the characteristics of the Human Visual System. Among them we select only four of them:
-
Relationship between object and background
-
Proximity
-
Similarity
-
Closure
Rule 1: Relationship between object and background
When we look at a scene, we always prioritize the regions of the scene and suddenly classify them into two categories; Important ones and unimportant ones. We call the important ones as objects and the rest as background. This ranking may be subjective and changes depending on the states of our brain. Objects are the essential regions. Background is just to see the objects. Without the background we cannot see an object, because our brain always takes the difference between two neighboring locations.
In order to extract objects from the background, we draw an imaginary boundary between the object and background. This imaginary boundary belongs to the object and defines its shape.

Discrimination of the object and background is a serious cognitive task. It requires substantial cognitive effort.

Most of the brain regions related to vision works as a difference machine:
-
We do not see the object, we just see the difference between the object and the background*
-
We do not see the colors, we just see the difference between the adjacent ones*
Video 5: When the color is coded in the brain, it is coded with respect to its surroundings. Carefully, watch the video and observe how you perceive the exact same color as different, when the background changes.
Rule 2: Proximity
Spatially close objects have a tendency to be a part of a whole. A very good example is a dot line. It is made out of hundreds of dots. However, we perceive it as a one single line, called, dot line.


Rule 3: Similarity
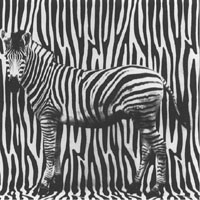
Similar objects are likely to be a part of a whole. Our brain has a tendency to unify similar objects to make a single object out of many.

Rule 4: Closure
Our brain has a tendency to complete missing information.
-
Even if an object is incomplete or broken into several pieces, our brain perceives it as whole.
-
We try to reach the whole in our mind by completing the missing parts.


The above rules show that Gestalt theory provides a holistic approach for HVS. Rather than decomposing a 3-dimensional scene into its hierarchical components, Gestalt theory proposes a set of rules to describe the vision. The rules enable us to design more realistic image processing systems, compared to Marr models. However, the rules mentioned above together with the other rules do not provide a complete theory for HVS, as in Marr theory. The rules are just based on our partial observations. Therefore, it is not possible to develop a computational model for the human brain, using the rules of Gestalt Theory.
Which one of these theories are better? The answer depends on the application domain. As can be easily observed from this brief overview, none of the vision theories are complete and fully verified by experimental neuroscience. They are based on our very limited observations about the human brain. I
The brain still lacks the capability of understanding and modeling itself and needs some more time to decipher its marvelous capabilities.
Characteristics of Human Visual System
Although we have a long way to go to fully understand the working principles of the Human Visual System (HVS), we can investigate some of its characteristics by vision experiments…
So far, we know that, our eyes constantly tear the physical world to pieces by sampling and quantizing the reflection of light received from the objects on the retina by photoreceptors, called rods and cones. On the contrary, our brain hierarchically integrates the pieces received from the retina, such that the world model generated by our brain looks and moves continuous.
Each of us generates a different world model even for the exact same scene, depending on a large number of varying factors, such as age, gender, genetic properties, education etc… These models are constantly changing as we keep receiving visual information. In short, our worlds are different.
Yet there are some shared operating characteristics of HVS. The abilities and limitations of the Human Visual System determines these shared characteristics, which are helpful to design image processing algorithms. In the following we shall study some important characteristics of HVS.
Resolution
One important characteristics of HVS is called resolution, which can be defined as the ability two separate
-
two adjacent pixels, called spatial resolution,
-
two colors, called radiometric resolution,
-
two frames, called time resolution.
Considering the fact that the eye is a feedback control system, the above resolutions are not fixed for HVS. They vary depending on many factors. For example
-
the amount of luminance,
-
distance of an object from the eye,
-
the current brain states,
-
health conditions,
-
the genetic properties of a person,
-
etc.
effects the resolutions defined above.
1. Spatial Resolution
Spatial resolution, describes the ability of any image acquisition device to distinguish small details of an object. The resolution of the human eye, which is a natural image acquisition device, is restricted by the physical size and number of the cones and rods, scattered over the retina.
Response of HVS to spatial resolution depends on two parameters:
-
Distance of an object from the eye: As the objects get farther to the eye it becomes smaller and the details disappear, yielding lower spatial resolution
-
Illumination of the environment: As the environment gets darker, the cones lose their sensitivity to capture the color, only the rods work to capture shape, in dim light vision.
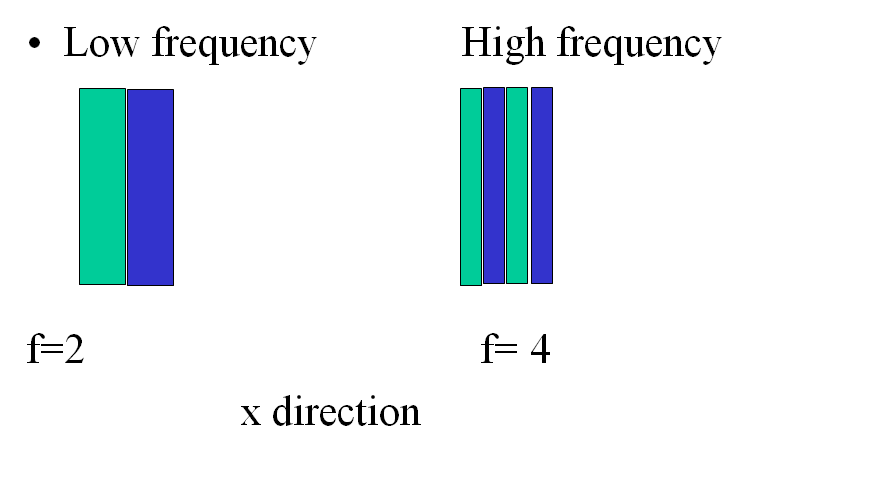
When a scene contains high frequency components, higher resolutions are needed to keep the information. A High frequency image consists of high variations in a small spatial size.
2. Radiometric resolution
Radiometric resolution is the response of our eye to intensity and color. Recall that the operating characteristics of HVS restricts the perception of colors into the visible band of the electromagnetic spectrum. This is basically because of the dynamic range of photoreceptors of the eyes, namely the rods and cones.
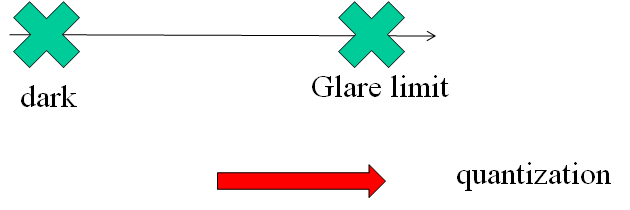
The cones and rods only process the light if it is in between dim light and glare limit (see; Figure 26). If the environment is totally dark, we cannot see.
-
In a very dim light the pupil gets large to capture all the available electromagnetic signals. The objects in the dim light appear to be just black and white. Because the cones do not work. This particular vision is called scotopic vision.
-
As we increase the amount of illumination, the pupil reduces its size to protect the operation characteristics of rods and cones. Objects look more colorful. Increasing the amount of light yields brighter colors. This particular vision is called photopic vision.
The change in pupil size is called brightness adaptation. When we enter a relatively dark room, at the first glance, we cannot see clearly. As the pupil enlarges, we start to perceive more details. The short curve between and shows the brightness adaptation, due to the size change of pupil, in Figure 27.
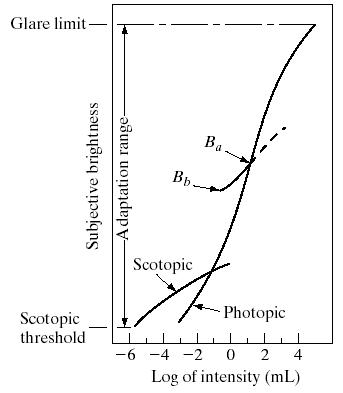
Brightness adaptation enlarges the dynamic range of visual perception, such that we can see in a dim light with enlarged pupil, as well as, we can see in glare light with shrunken pupil. However, brightness adabtation results in perceiving the same scene in different colors and shapes, depending on the amount of illumination together with the pupil size.
3. Time resolution
Time resolution is the response of our eye to discriminate two consecutive time frames in a video. Human eyes cannot discriminate the changes in alternating current, because its frequency is 50 Herts. That is why we perceive the light coming from a bulb as a constant illumination, although it flickers 50 times per second.
When two consecutive and discontinuous stimuli are presented to the eye, they are perceived as separate, if the rate at which they are presented is below a certain value. If the rate of presentation of the intermittent stimuli is slow, it produces the sensation called flicker. Above a certain critical rate, the flicker ceases. As in the other resolution types, the critical flicker frequency of human eyes varies by many factors.
Weber’s Law for Just Noticeable Difference
Suppose that we take two cans of dye, one is black and the other is white. When we put a single drop of white color into the black die, can we discriminate it from pure black? How and when do we start to differentiate two very close colors?
The difference threshold, when we start to discriminate between two very similar colors is called Just Noticeable Difference (JND).
JND is the minimum amount by which stimulus intensity must be changed in order to produce a noticeable variation in sensory experience.
Ernst Weber observed that the size of the difference threshold is related to the magnitude of the initial stimulus. This relationship, known since as Weber’s Law, can be expressed as:
where (delta I) represents the difference threshold, represents the initial stimulus intensity and signifies that the proportion on the left side of the equation remains constant despite variations in the term.
Weber’s Law reveals that JND, , is a constant proportion of the original stimulus value.
Example 2.1: Let us present two spots of light each with an intensity of 100 units to an observer. Suppose that, JND threshold is , to discriminate the brightness levels of two spots. If the light intensity of two spots were 150 units, what is the corresponding ?
Answer:Obviously, k=0.1 and it should remain constant, according to Weber’s law. Thus, when two spots have 150 units of intensity, then ? This example shows that as the intensity is increased JND threshold increases proportionally.
Interestingly, Weber’s Law is valid for a wide range of sensory modalities, such as brightness, loudness, mass, line length, etc. Although the Weber ratio varies across modalities, it remains constant within a specific modality.
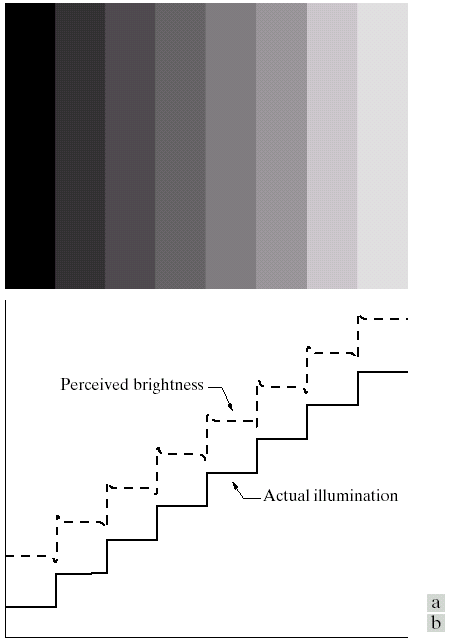
Mach Band Effect
Mach bands effect is an optical illusion caused by image enhancement implicitly applied by the rods on retina.
It is first observed by Ernst Mach, who noticed that HVS exaggerates the contrast between edges of the slightly differing shades of gray, as soon as they contact one another, by detecting the edges in the retina.
Simultaneous Contrast
As we mentioned before, the surrounding color of a region affect the color of the object.

Image acquisition devices (Optional Reading)
Digital image acquisition devices create digitally encoded representation of the visual characteristics of the physical world, such as a scene or the interior structure of an object or temperature variations etc.
Recall that our eyes convert the visible light to electrochemical signals to generate a digital image. In spite of marvelous abilities, human eyes can only perceive 7% of the electromagnetic spectrum. The above definition of image acquisition devices not only expands the electromagnetic spectrum, it also includes visualizing some invisible quantities such as pressure or heat.
The image acquisition technology has progressed very rapidly over the last decade. Thousands of different products have been developed for a wide range of applications.
The available image acquisition devices convert not only the visible light but the entire electromagnetic spectrum into electrical signals. These signals are later mapped into the color codes of the visible bands.
The technology to produce the tremendous amount of image acquisition devices can be grouped in three major categories:
-
Three types
-
Single sensor (scanners)
-
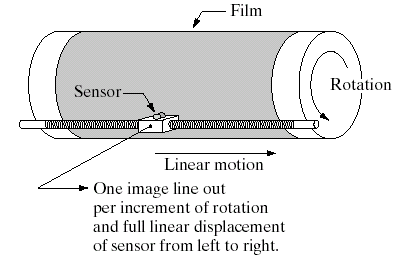
Sensor stripes (xerox, tomography), circular sensor stripes
-
Sensor arrays (cameras)


Optional reading assay: An emerging technology: Single pixel camera
https://aapt.scitation.org/doi/abs/10.1119/1.5122745?journalCode=ajp
Video 3: A short video which explains the working principle of a single pixel camera.