 |
![\includegraphics[width=\linewidth]{penguentree}](hw2_img1.png) |
|
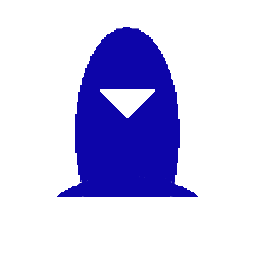
| Rendered image | Tree of shapes | |
 |
 |
|
| Shape borders | Shapes filled |
In this homework, you will have a genetic programming application that will try to match a geometric description on a rendered 2D image.
|
|
|
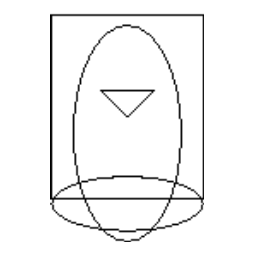
| Rendered image | Tree of shapes | |
|
|
|
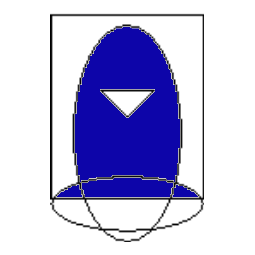
| Shape borders | Shapes filled |
There are only 3 operations are defined for shape composition:
As terminals, you will have 3 basic shapes:
All coordinates are integers in the range [0..255]. You have a 256x256 image and you will be given a sample of points with inside/outside information as inputs. Each individual will be a tree of geometric compositions. For the fitness evaluation, you will make inside/outside test for all sample points for the shape represented by the individual, and compare results with the input information. Also compactness (the number of nodes) of the tree will be favored in fitness. However it should not be important than the accuracy. You can assume that the input images can be represented by composition of at most 20 basic shapes.
You can introduce additional terminals/non-terminals (i.e.
geometric transformations) as long as they are convertible to
existing sets. Input image information will be given as a text
file consisting of triplets in each line:
x y v
Where v is either 0 or 1 denoting outside and inside
respectively. Some input cases will be provided on the course
web page.
You can use any variety of tree based encodings any evolutionary parameters, operators etc. as long as you explicitly state them. Also you can try some enhancement to improve performance. You can use galib tree encoding or other system like Open Beagle (http://beagle.gel.ulaval.ca/index.html), Beagle Puppy (a limited version of Open Beagle).
Please repeat your experiments for at least 10 times for each test
data. Report your results with the following format:
Topic: Shape recognition with GP
Name surname: Id:
GP Parameters:
Population size:
Crossover/mutation rates:
Type of crossover/mutation:
Selection mechanism:
% of Elitism:
Maximum depth allowed:
Additional alphabet elements and functions:
Any additional enhancement used:
Fitness function:
Results
..... ..... .......... ......... .......... .......... ........ ..... ..... .......... ......... .......... .......... ........ ..... ..... .......... ......... .......... .......... ........
Figure 1: Generation vs best and average fitness (test case 2)
Figure 1: Generation vs best and average fitness (test case 2)
..... ..... .......... ......... .......... .......... ........ ..... ..... .......... ......... .......... .......... ........ ..... ..... .......... ......... .......... .......... ........